Plots Of Client Data
Plots can be produced in much the same way as reports i.e. filter to
display the appointments and services you are interested in and then
select a type of diagram from the Plots menu.
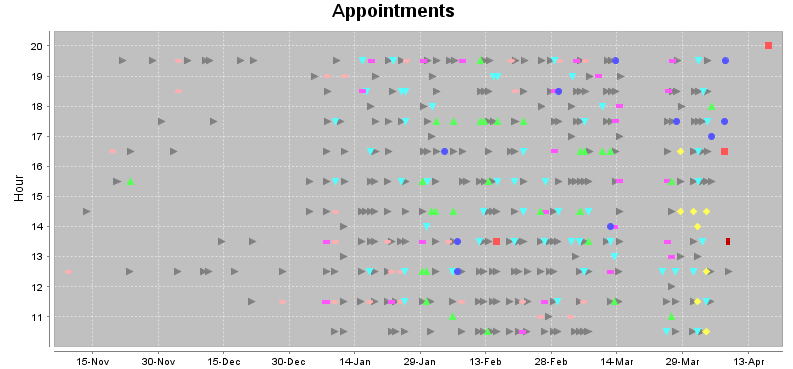
For example, if you select the “Plot appointments” menu item you
will see something like the following showing appointment times:
Home